
Whether for reasons of quantity or quality, drinking can get expensive quickly. Americans spend over $37 billion annually on beer, in part because of pricey craft brewery offerings. Similarly, hard liquor suppliers have enjoyed record sales in recent years, driven by consumer interest in high-end spirits. Even wineries are raking in more revenue than ever, despite uncertain enthusiasm among younger generations. Clearly, booze is a booming business.
But are Americans feeling the hangover in their wallets? Some say staying sober can lead to significant savings in the long run, especially for those who go out often. To test this hypothesis, we analyzed data from the Bureau of Labor Statistics’ Consumer Expenditure Survey, a national study of how families and individuals spend their hard-earned income. Our results reveal current and historical trends in alcohol expenditures, and which demographics burn the most cash on getting buzzed. To see how America’s drinking habits translate into dollars, keep reading.
Breaking The Bank For Booze?
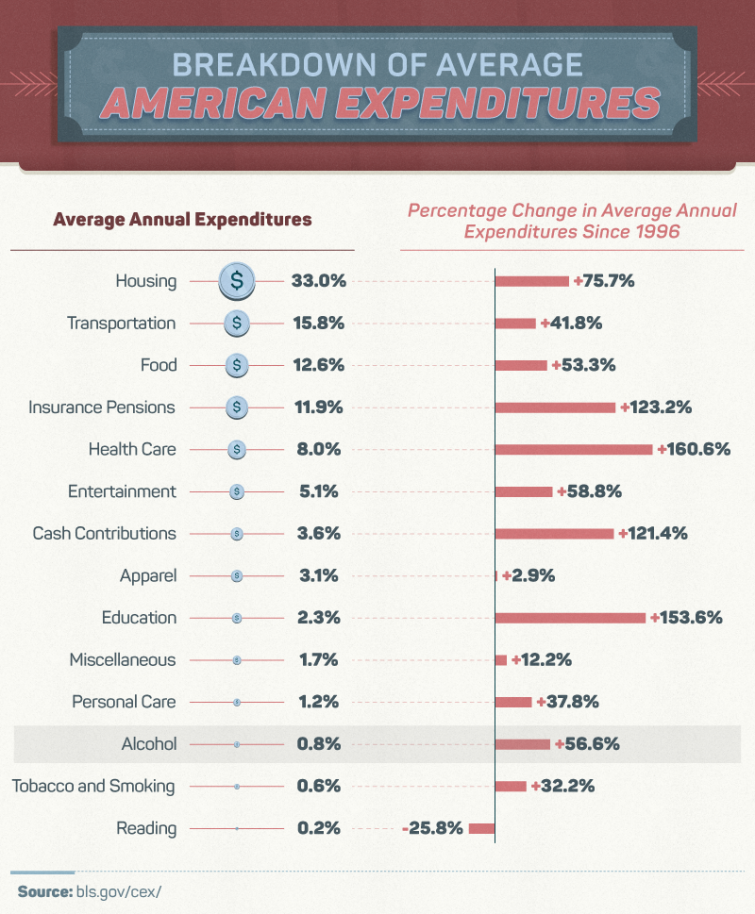
To study Americans’ drinking expenses over time, we utilized data from 1996 through 2016, the most recent 20 years on record. That time frame witnessed a remarkable surge in spending in certain categories: Average annual education and health care expenditures increased more than 150 percent. But alongside rising costs related to those necessities, spending on vices spiked as well. Tobacco and smoking expenses increased 32 percent, due partially to rising taxes imposed on cigarettes. And alcohol spending increased even more sharply, growing nearly 57 percent over that 20-year period.
This growth in alcohol spending could be attributable to increased consumption, especially in demographics historically disinclined to stop drinking. Recent studies have found rising rates of drinking among women and older Americans since the 1990s. Additionally, a specific beverage has enjoyed increased interest: Annual wine consumption increased by 449 million gallons between 1996 and 2016. Additionally, this period witnessed an explosion of premium beverage offerings – accompanied by premium prices. The craft beer boom began in the mid-2000s, resulting in the wide availability of products that cost more than the average domestic brew.
Alcohol Investment
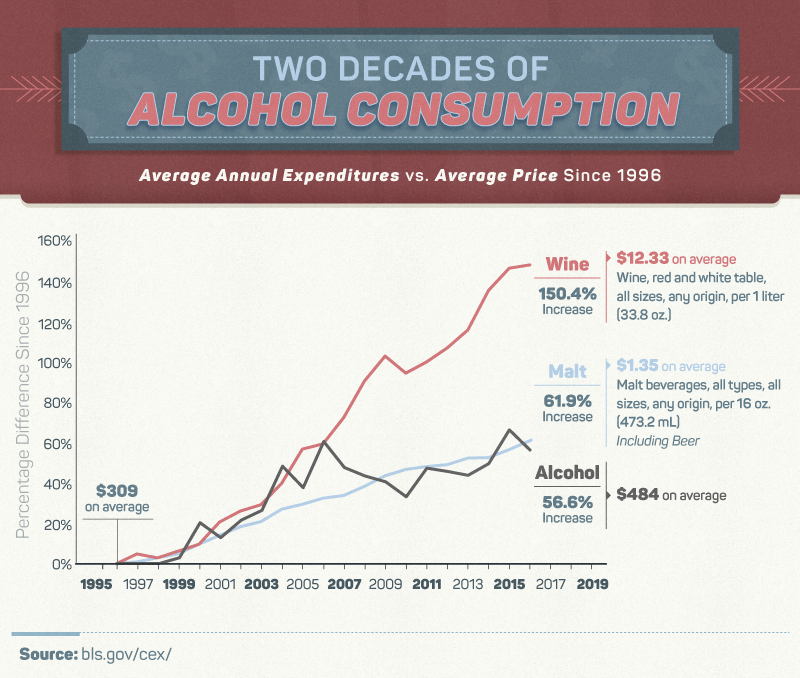
Between 1996 and 2016, the average amount Americans spent on alcohol annually rose by $175. That represents a 56.6 percent increase over that 20-year period. But how much of increased spending is attributable to rising alcohol prices, and how much results from Americans simply drinking more? To find out, we juxtaposed the typical American’s alcohol expenses with the average price of wine and malt beverages in each year. It turns out that beer prices surged over 61 percent during that time, and wine prices increased by over 150 percent since 1996.
These price spikes suggest that rising costs account for much of the increase in Americans’ alcohol spending: People may not be drinking more frequently, but they’re definitely paying more for the privilege of the pint. Much of this is attributable to inflation and the rising prices associated with the aforementioned craft beverage boom. In 1996, the typical beer cost about $2.61, according to one study. In 2016, the average brew price was $3.99.
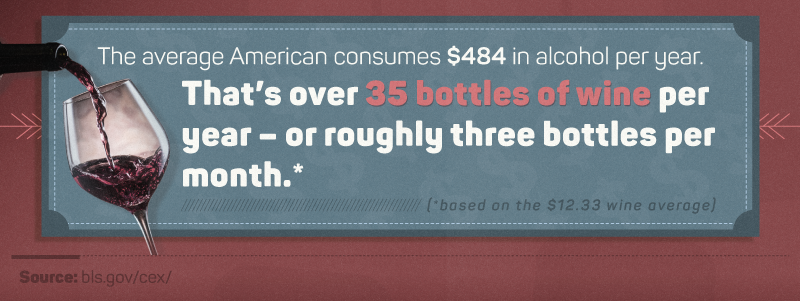
That doesn’t mean Americans aren’t drinking in large quantities, however. At $484, the average annual alcohol expenditure, a person could buy about three bottles of wine each month. Additionally, it’s worth noting that more than a quarter of Americans consume no alcohol at all. Assuming that this sober cohort spends no money on alcohol, those who do drink likely spend considerably more than $484 annually on average.
Drinking Demographics In Dollars
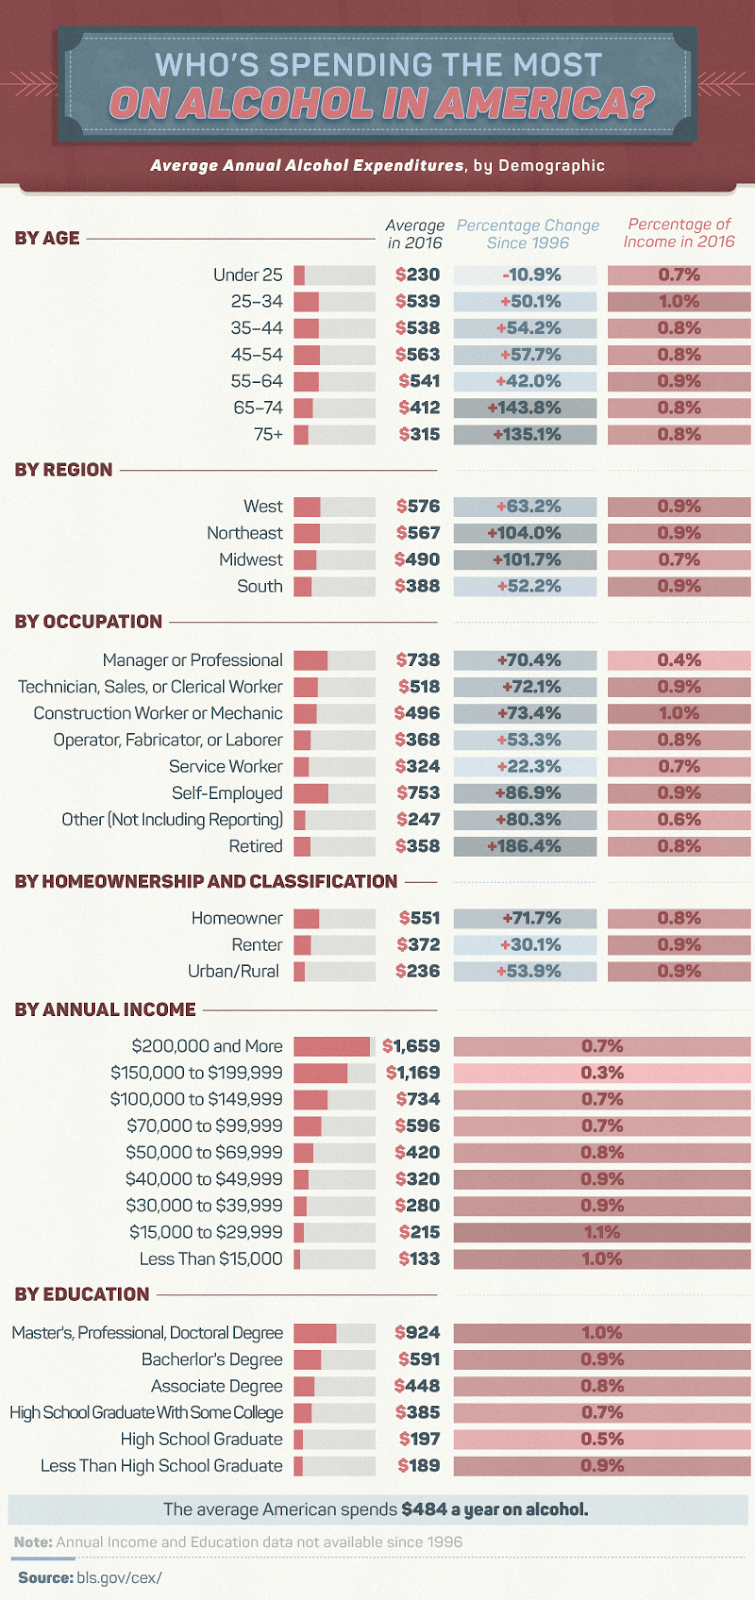
Which demographics have driven increased spending on alcohol over the 20 years studied? Our findings suggest that older Americans increased their alcohol spending dramatically, which resonates with growing public health concerns pertaining to baby boomers and booze. In a related finding, retired professionals spent 186 percent more money on alcohol. Conversely, those younger than 25 spent less in 2016 than in 1996, attesting to a trend in millennials choosing to live sober.
Certain regions spent significantly more in 2016 than they did 20 years before: In the Northeast and Midwest, alcohol expenses surged more than 100 percent. Interestingly, those who earned more than $200,000 annually spent more than $1,600 on alcohol each year on average, but these costs represented a smaller portion of this group’s income than in lower income brackets. These findings remind us that alcohol spending must always be judged in light of one’s means: If your funds are limited, even modest spending on drinks can prove problematic.
Tipsy City Spending
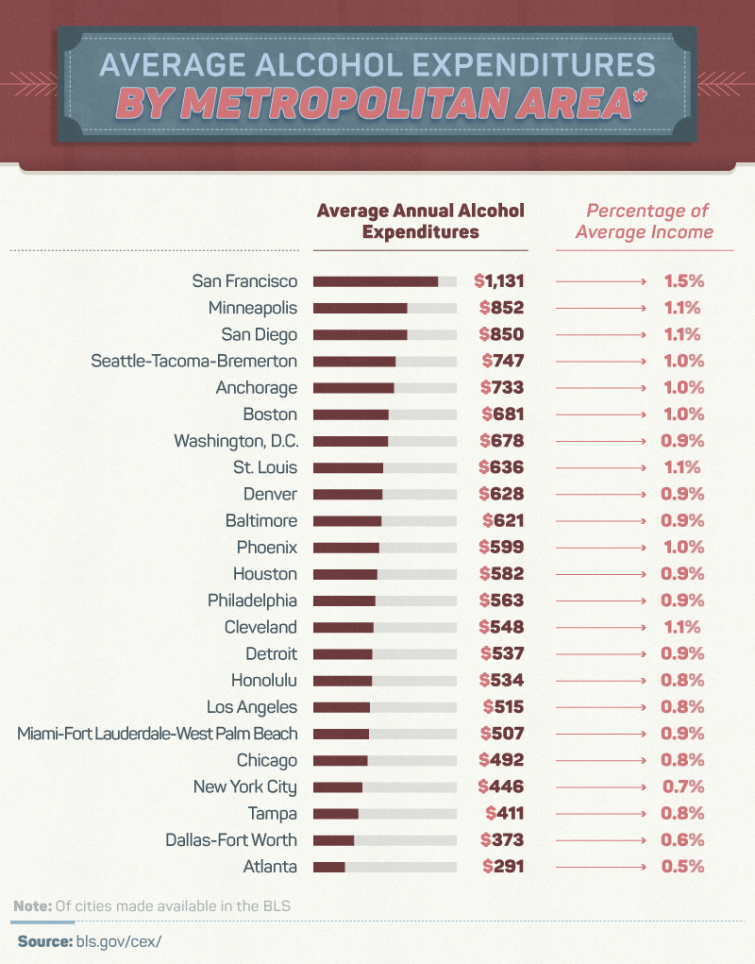
Among major metropolitan areas, San Francisco spent the most money on alcohol, both in terms of dollars spent and percentage of average income. That could reflect the city’s proximity to California’s wine country, or simply the Bay Area’s sky-high cost of living. At the southern end of the state, San Diego also spent big on booze, with average expenditures exceeding $850. The only other metropolitan area to spend as much was Minneapolis, although other Midwestern urban areas also had strong drinking cultures. Residents of Cleveland and St. Louis also spent more than 1 percent of their average income on alcohol.
Conversely, some metropolitan areas spent relatively modestly on alcohol. These included some major Southern population centers, including Atlanta, Dallas-Fort Worth, and Tampa. Additionally, New York and Chicago ranked in the bottom five in terms of average alcohol expenditures. While none of these cities lack for establishments serving or selling liquor, residents spent less than $500 a year on drinking on average.
Too High A Price To Pay
According to our data, recent decades have seen a definite surge in spending on alcohol, particularly in some places and populations.
Much of this trend is attributable to changing prices that have climbed steadily across the country since 1996.
But in the face of these rising expenses, it’s important to recall that all of this spending is optional:
Alcohol money could be used for other luxuries, which would likely deliver more lasting enjoyment. Instead of resigning themselves to more and more spending on drinking, consumers are free to invest in better sources of relief than booze.
When it comes to your health and hard-earned money, it’s certainly an experiment worth trying.
Of course, drinking’s downsides can be far more than financial. If you or someone you love is struggling with a drinking problem or the use of other substances, the personal price you pay can be severe. Our team of treatment experts and advisors can help you evaluate your options so that you can choose ethical and effective care. To meet our team of clinicians or learn more about our resources and programs, explore our website today.
Methodology
For this project, we tapped into the Bureau of Labor Statistics’ Consumer Expenditure Survey which is conducted each year. Information on average consumer expenditures is provided year over year. Data were collected from 1996 to determine the average price of alcohol over the last decade, along with a more granular look at 2016 alcohol expenditures for various demographics.
Fair Use Statement
Unlike alcohol, our content comes to you at no cost. In fact, you’re welcome to share our images and information with your own audience for any noncommercial use. If you do, simply link back to this page to attribute us appropriately.