
Whether it’s in the comfort of your own home after you’ve clocked out or during an office mixer, work and alcohol are often tied together. In some industries, an overarching “booze culture” makes drinking on the job an essentially unspoken rule. One study that focused on blue-collar workers found that workplace alienation, stress, and drinking culture often caused people’s alcohol consumption to spike.
So in a world where drinking can be encouraged and even expected in a workplace context, we wanted to understand which industries were populated by the biggest drinkers and how their habits have evolved over the years.
To do so, we relied on the data from the Centers for Disease Control and Prevention’s (CDC) National Health Interview Study from 2013 through 2017. This research compiled responses from nearly 27,000 respondents belonging to 25 industry categories. Here’s what we found.
Annual Alcohol Consumption
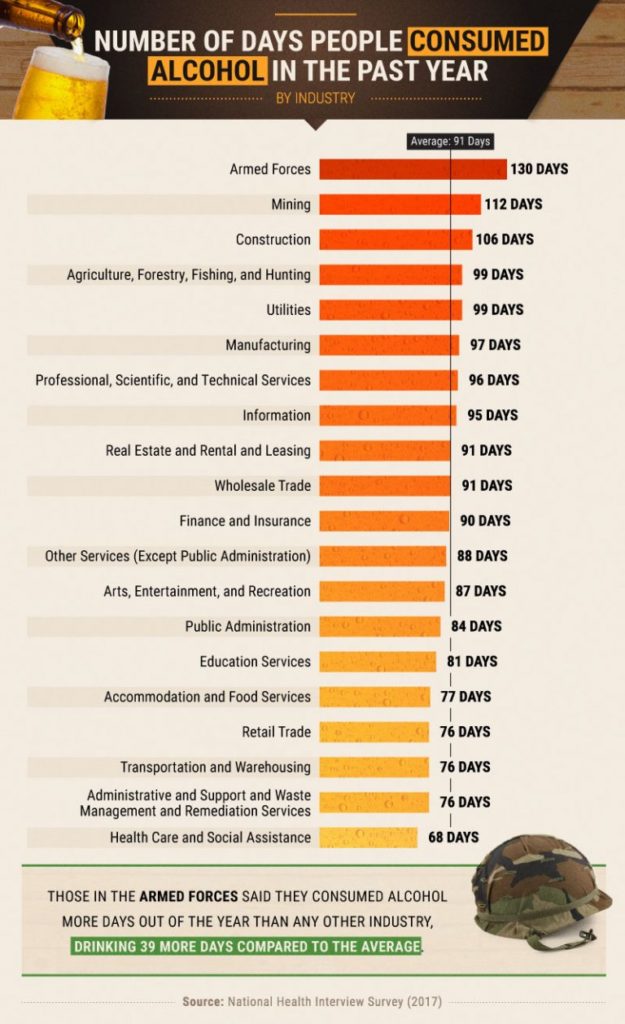
Work can be stressful. Life can be stressful. At the end of a long day, cracking open a cold one while sinking into the couch cushions is a sacred moment of relaxation for many. To start, we wanted to know which industry accounted for the highest number of days where a person drank throughout the year.
Respondents in the armed forces reported the most alcohol consumption overall, with employees in this industry reaching for an alcoholic beverage 130 days of the year on average – that’s at least one drink every 2.8 days. Workers in the mining industry were the second-most frequent drinkers at 112 days in the past year, followed by construction workers at 106 days last year.
The relationship between military personnel and alcohol has a long history of contention and difficulty. According to a recent survey conducted by the Department of Defense, one-third of service members meet the criteria for hazardous drinking as well as a possible alcohol misuse issue.
Consumption Habits: Stagnant or Shifting?
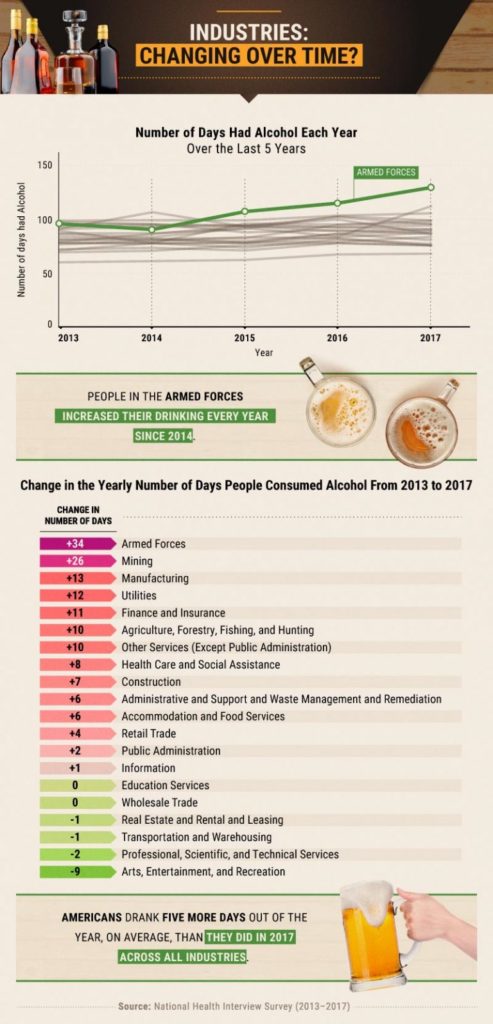
Over the past couple of years, alcohol consumption in the United States has gone down overall. In 2017, Americans drank 0.2 percent less than they did the previous year – and while that decline might seem negligible, it is still twice as much as the decrease recorded in 2016. Given this slight downward slope, we wanted to know which industries followed suit or bucked the trend.
While a large number of sectors remained stagnant in their consumption or even reduced the number of days per year they drank alcohol (most notably, arts, entertainment, and recreation, which reported nine fewer drinking days in 2017 compared to 2013), others experienced a drinking spike.
On average, members of the armed forces consumed alcohol 34 more days out of the year in 2017 than they did in 2013, while mining workers increased their intake by 26 days. The former demographic has steadily consumed more and more alcohol each year since 2014, while the mining industry saw a particularly aggressive increase in 2016.
How Many Drinks per Session?
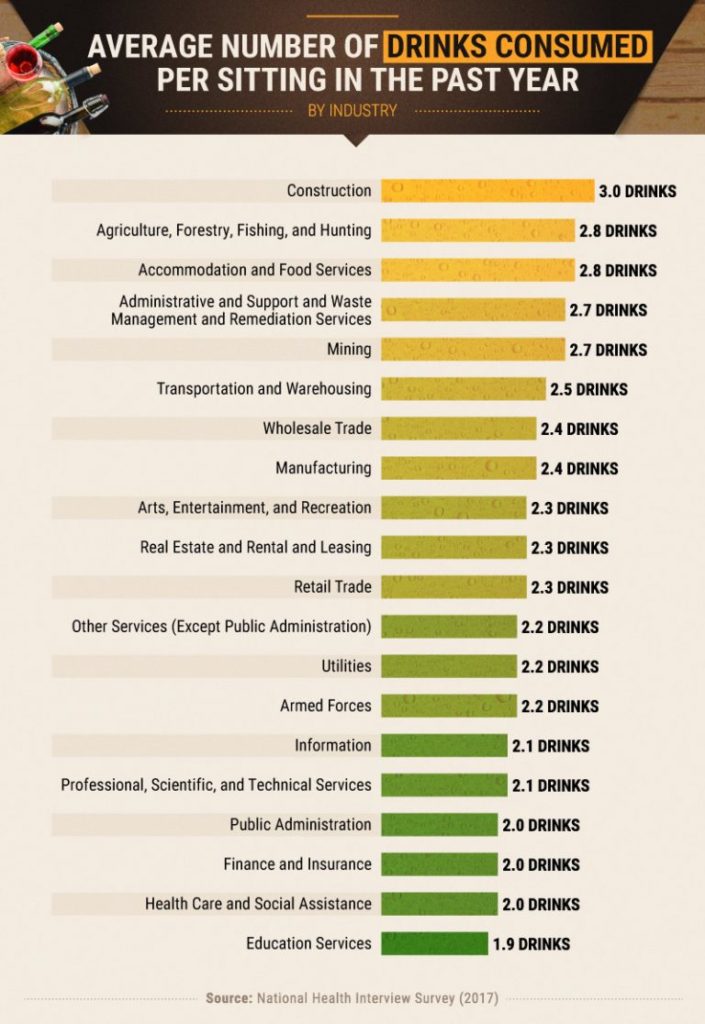
According to the Office of Disease Prevention and Health Promotion’s dietary guidelines, “moderation” is no more than two drinks per day for men and one drink per day for women. While most industry averages for daily consumption were more or less in line with the recommended maximum for men, some exceeded that figure – and no sector even came close to the women’s moderation benchmark.
Respondents in construction sat down to an average of three alcoholic beverages each sitting, followed by a tie between the accommodation and food services industry and the agriculture, forestry, fishing, and hunting industry.
The construction industry, in particular, is known to be affected by alcohol abuse issues, an issue that is associated with more risks than meets the eye. People who drink alcohol three times per week or more have an elevated risk of at-work injuries, and construction workers are exposed to many environmental hazards on the job. If employees show up in a state that is anything besides entirely sober, they might end up gravely injuring themselves or others.
Binge Drinking by the Numbers
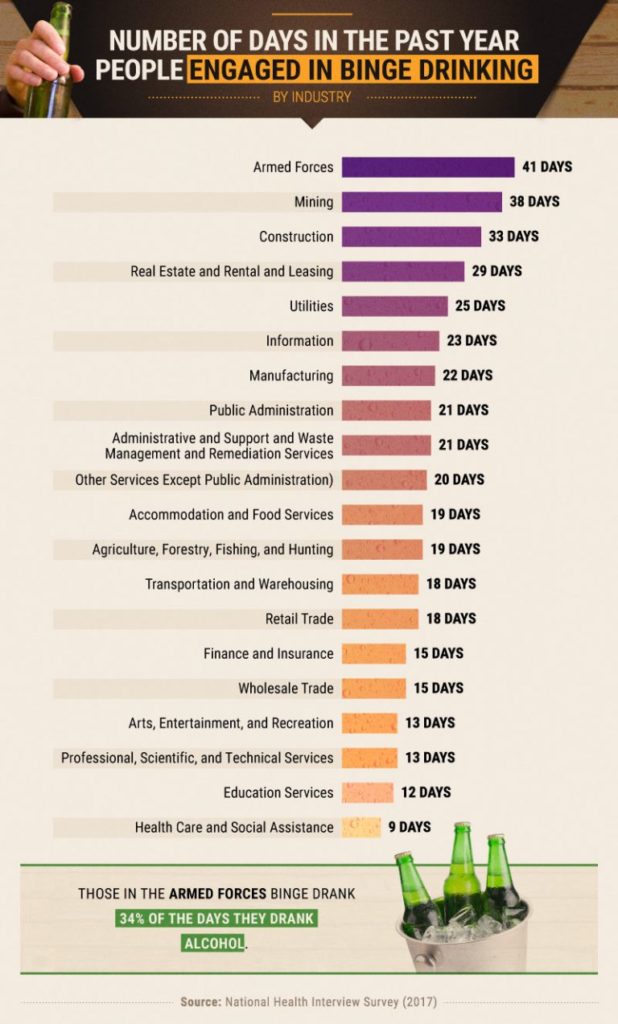
When it comes to drinking, Americans are no strangers to having a few (or way) too many. According to the CDC, the 18-to-24 and 25-to-34 age brackets represent the highest number of binge drinkers, and men are twice as likely to drink to excess than women.
Employees in the armed forces reported the highest number of binge days per year at 41 – that’s approximately one every nine days.
Mining industry workers were not far behind with 38 days of excessive drinking every year, followed by construction workers at 33 days per year.
On the other side of the coin, health care and social assistance employees binged the absolute least, with just nine days of excessive drinking under their belts throughout the year.
Members of the armed forces are especially prone to binge and hazardous drinking: One Department of Defense health survey found that 42.6 percent of Marine Corps service members had engaged in binge drinking within the last 30 days, followed by 34.2 percent of Navy sailors.
Additionally, our data revealed that when armed forces personnel consumed alcohol, they binged 34 percent of the time.
A Year in Drinks
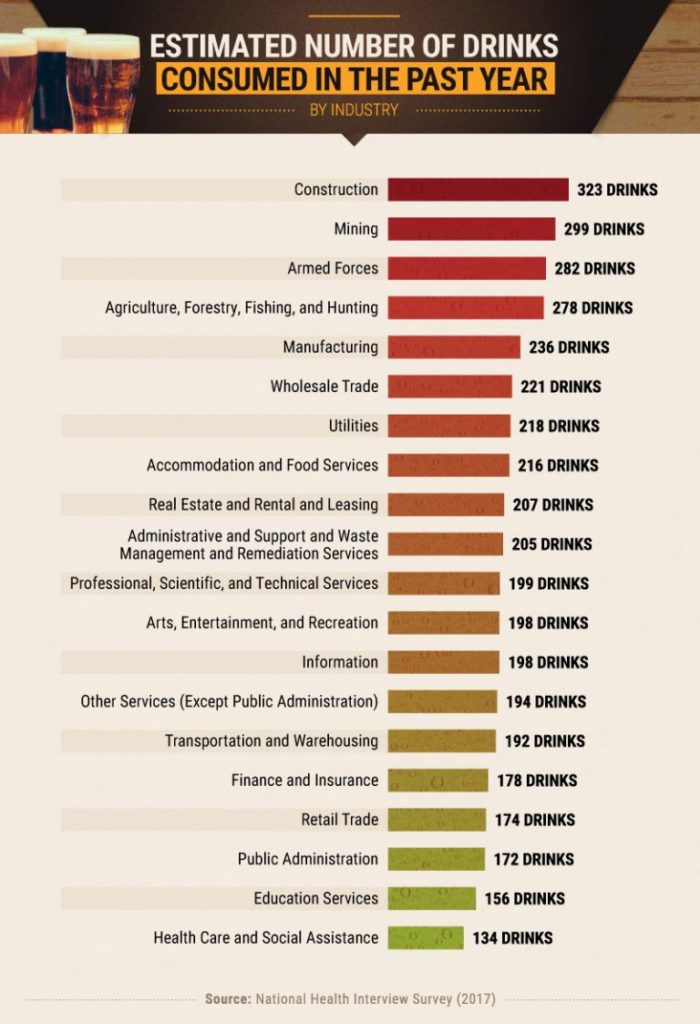
In the year that preceded the CDC’s survey, construction workers said they had consumed 323 drinks in total – that’s the equivalent of one alcoholic beverage almost every day. While just one glass of beer or wine per day might sound like moderation, the Mayo Clinic warns that in some cases, consuming alcohol at that frequency may pose an increased risk to the drinker’s health.
Mining industry employees were not far behind with an average of 299 drinks per person over one year, followed by armed forces with 282 drinks. At the other end of the spectrum, health care and social assistance professionals consumed an average of 134 drinks during the year – even the least frequent drinkers still had an alcoholic beverage once every three days or so.
The good news is that drinking in moderation – and not feeling like you’re missing out – is a habit that can be developed with a little effort and mindfulness. Tracking your consumption, avoiding situations in which you’ll be around other heavy drinkers, and spacing things out with food and water are a few simple ways to ensure you maintain a healthy relationship with alcohol.
Moderation Always Wins
Our survey revealed that certain industries have a significant bent toward alcohol consumption and binge drinking. More often than not, the armed forces, construction, and mining sectors found themselves at the top of the list for everything from binge drinking frequency to the number of drinks consumed over a year.
After years of in-depth research and countless individual studies, the jury is still out regarding whether occasional alcohol consumption might be good for you, or whether abstinence is the absolute healthiest path. Until those results emerge as conclusive, though, the name of the game is moderation, staying safe, and drinking responsibly.
If you or a loved one has issues related to addiction, we’re here to help. Delphi Behavioral Health Group can connect you to the treatment options that suit you best, from outpatient facilities to medical detox centers. Visit delphihealthgroup.com to learn more about your options and take the first step along the path to recovery and wellness.
Methodology
| Data for this study come from the Centers for Disease Control and Prevention’s (CDC) National Health Interview Survey (NHIS) from 2013 through 2017. 2017 is the latest year where data are available. There were 26,743 respondents to the 2017 survey. The industry breakdown is as follows: Health Care and Social Assistance 3,513Manufacturing 2,923Education Services 2,688Retail Trade Industries 2,485Professional, Scientific, and Technical Services 1,778Construction 1,531Public Administration 1,526Accommodation and Food Services 1,488Never Worked or Refused 1,165Other Services (Except Public Administration) 1,164Finance and Insurance 1,124Transportation and Warehousing 1,084Administrative and Support and Waste Management and Remediation Services 972Information 563Wholesale Trade 555Arts, Entertainment, and Recreation 487Real Estate and Rental and Leasing 475Agriculture, Forestry, Fishing, and Hunting 395Refused, Classified 277Utilities 230Mining 142Armed Forces 81Not Ascertained 48 Don’t Know 37Management of Companies and Enterprises 11Those who responded: “Management of Companies and Enterprises” were excluded for a low sample size. Those who responded “Never Worked or Refused,” “Refused, Classified,” “Don’t Know,” or where the industry was not ascertained were excluded for ambiguity. For “Change in the Yearly Number of Days People Consumed Alcohol From 2013 to 2017,” the change was calculated by subtracting the average number of days people drank alcohol in 2017 by the average in 2013, broken down by industry. |
Limitations
| These data lean on the memory recall of respondents of how many days out of the past year they had alcohol and the number of drinks they had when they did. This is self-reported data. This sort of data comes with some inherent limitations, including selective memory, exaggeration, and telescoping. We can’t be sure how close our results match up with reality. For the number of drinks per sitting, there is a possibility that respondents had more than one sitting a day. So they may have had more than the number of drinks listed above in a day. The NHIS data did not make it clear what type of alcohol these respondents were drinking. FAIR USE STATEMENTAre you surprised that people are drinking more days out of the year as of late than they did five years prior? Maybe you aren’t. Either way, if you thought this was interesting, you should share it with others so that they can look over our results. Just make sure that it’s for non-commercial purposes and that you link back to this page, so readers can take in the full scope of our study. |